Retail Markets
What are TSCG Retail Markets?
TSCG Retail Markets are purpose-built geographic districts, more than 4,400 of them nationwide, drawn around how and where people actually shop, not around postal routes or political lines. Each market follows natural retail corridors, respects census block-group boundaries, and gives analysts a single, stable frame of reference for everything from site selection to territory design.
See the market. Move smarter and faster.
TSCG Markets simplifies the complex retail landscape into a set of clean, retail centric boundaries – so you can pick sites, plan portfolios, and benchmark performance faster.
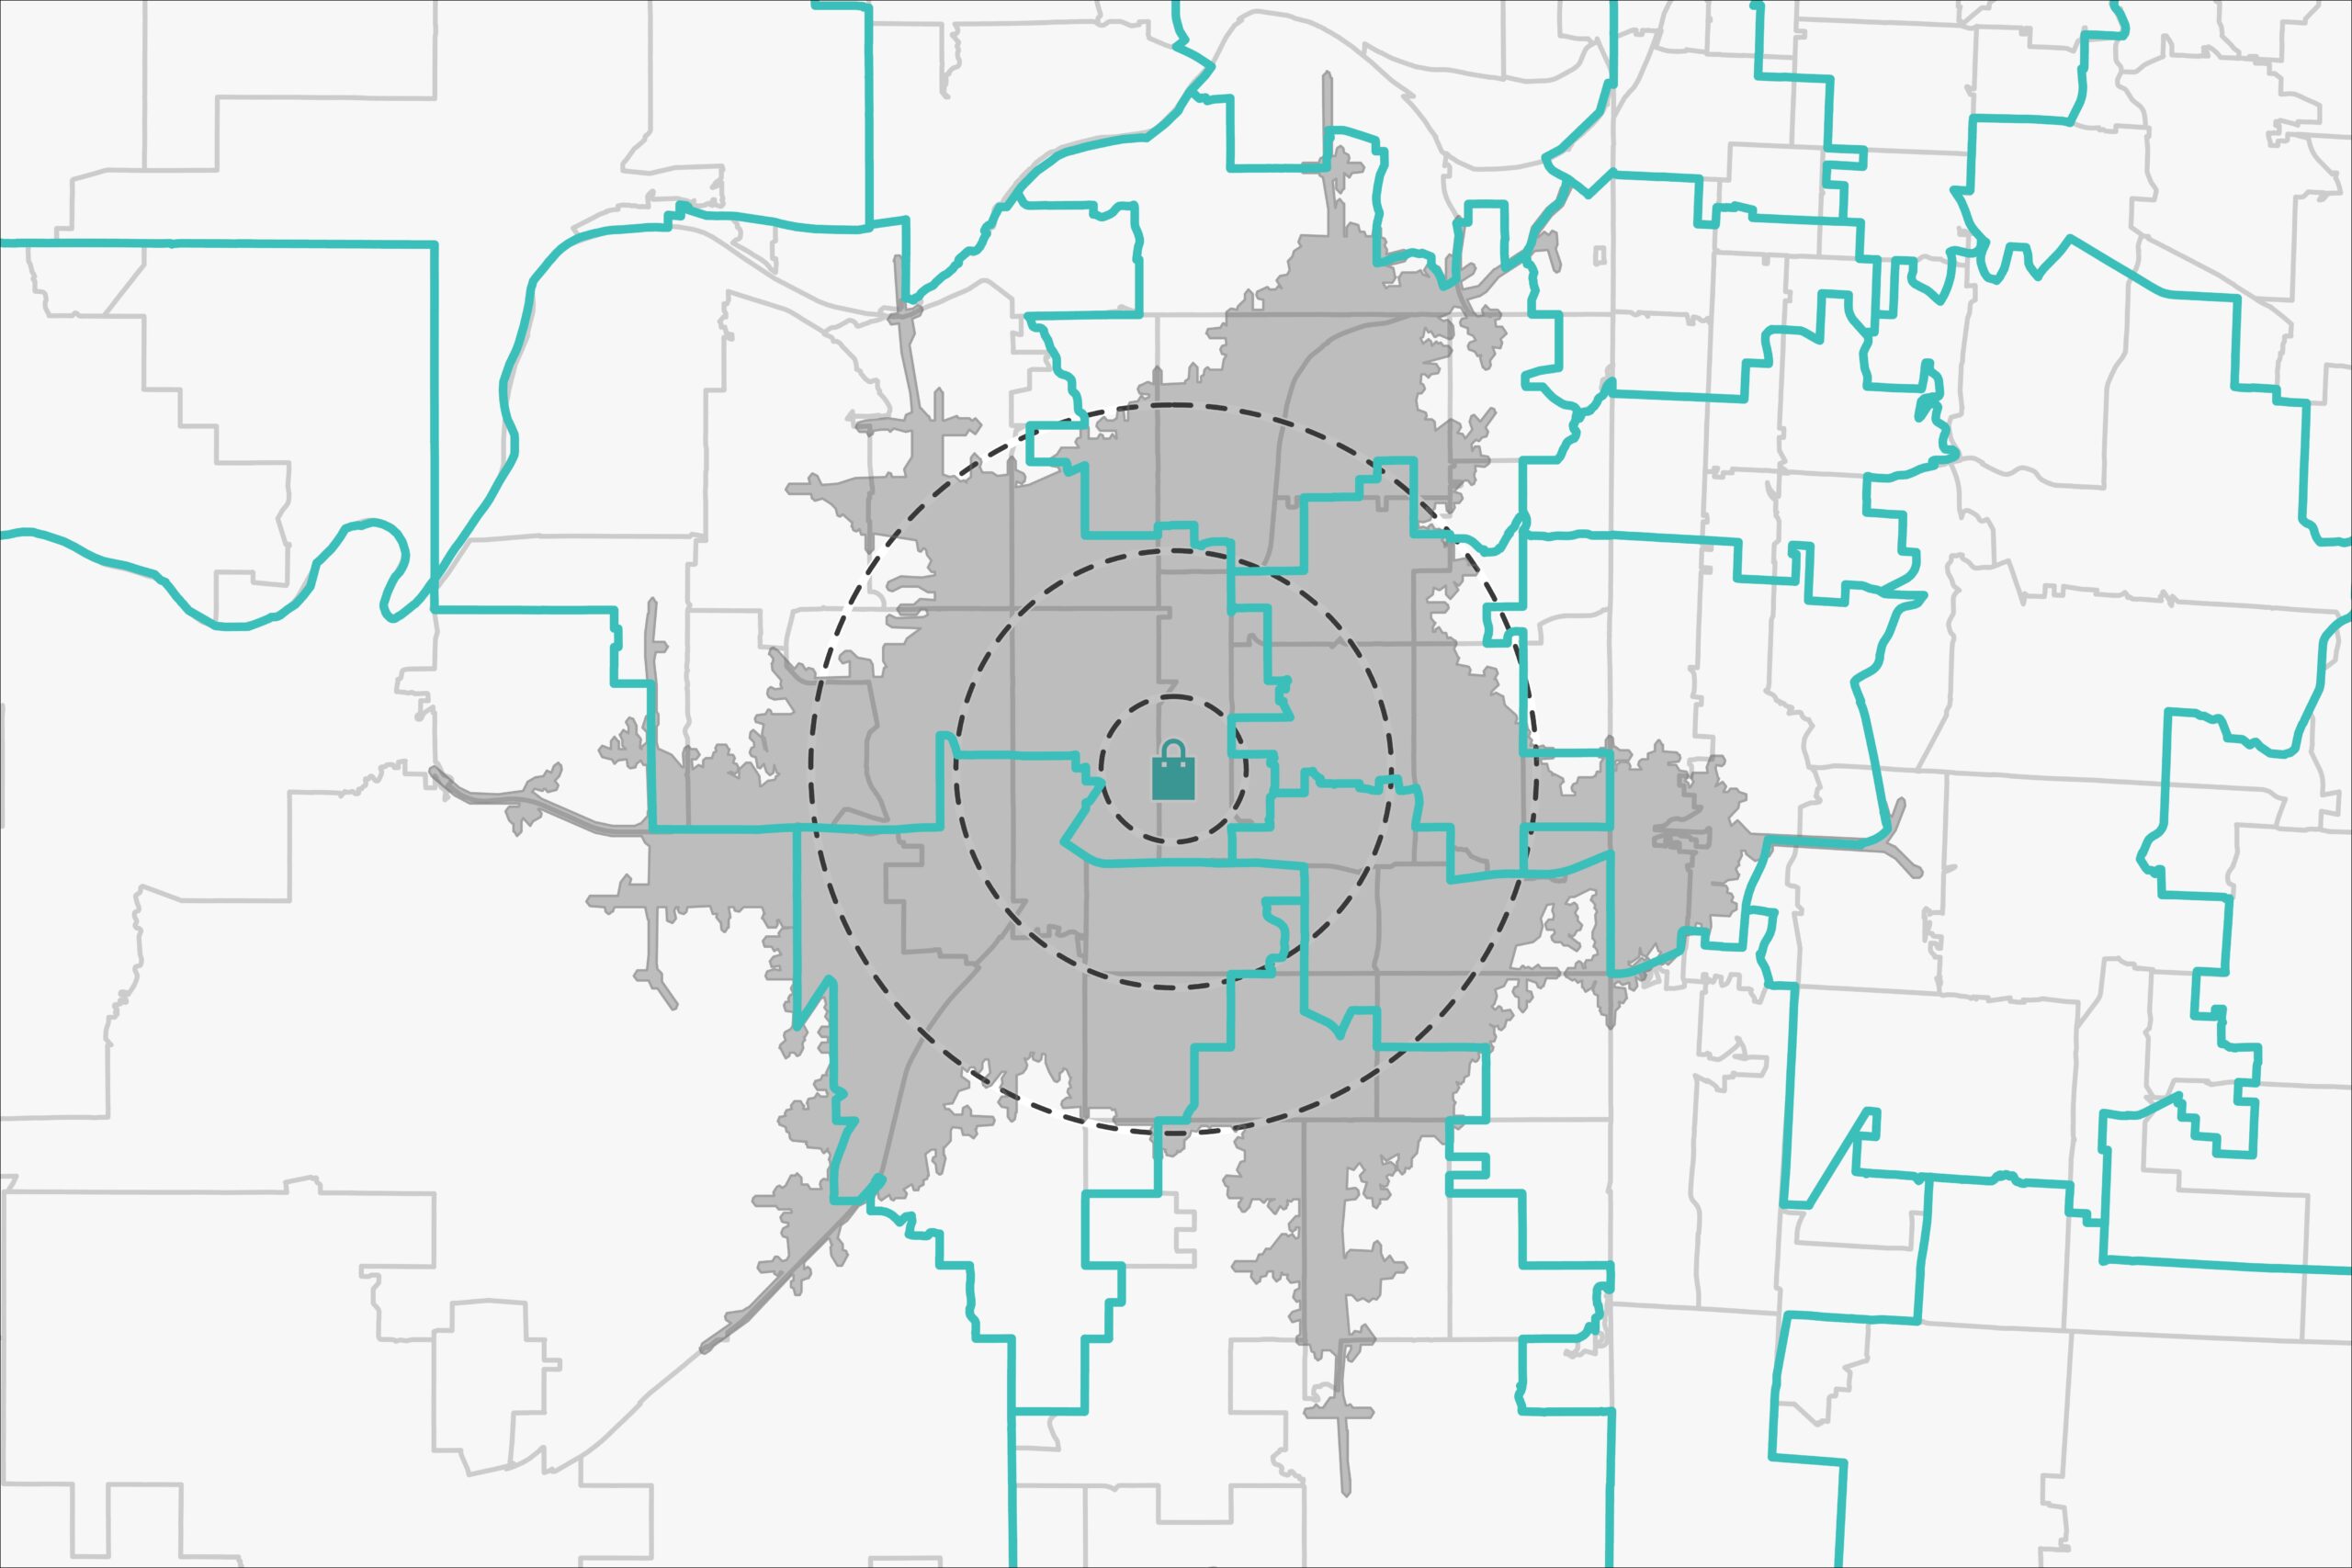
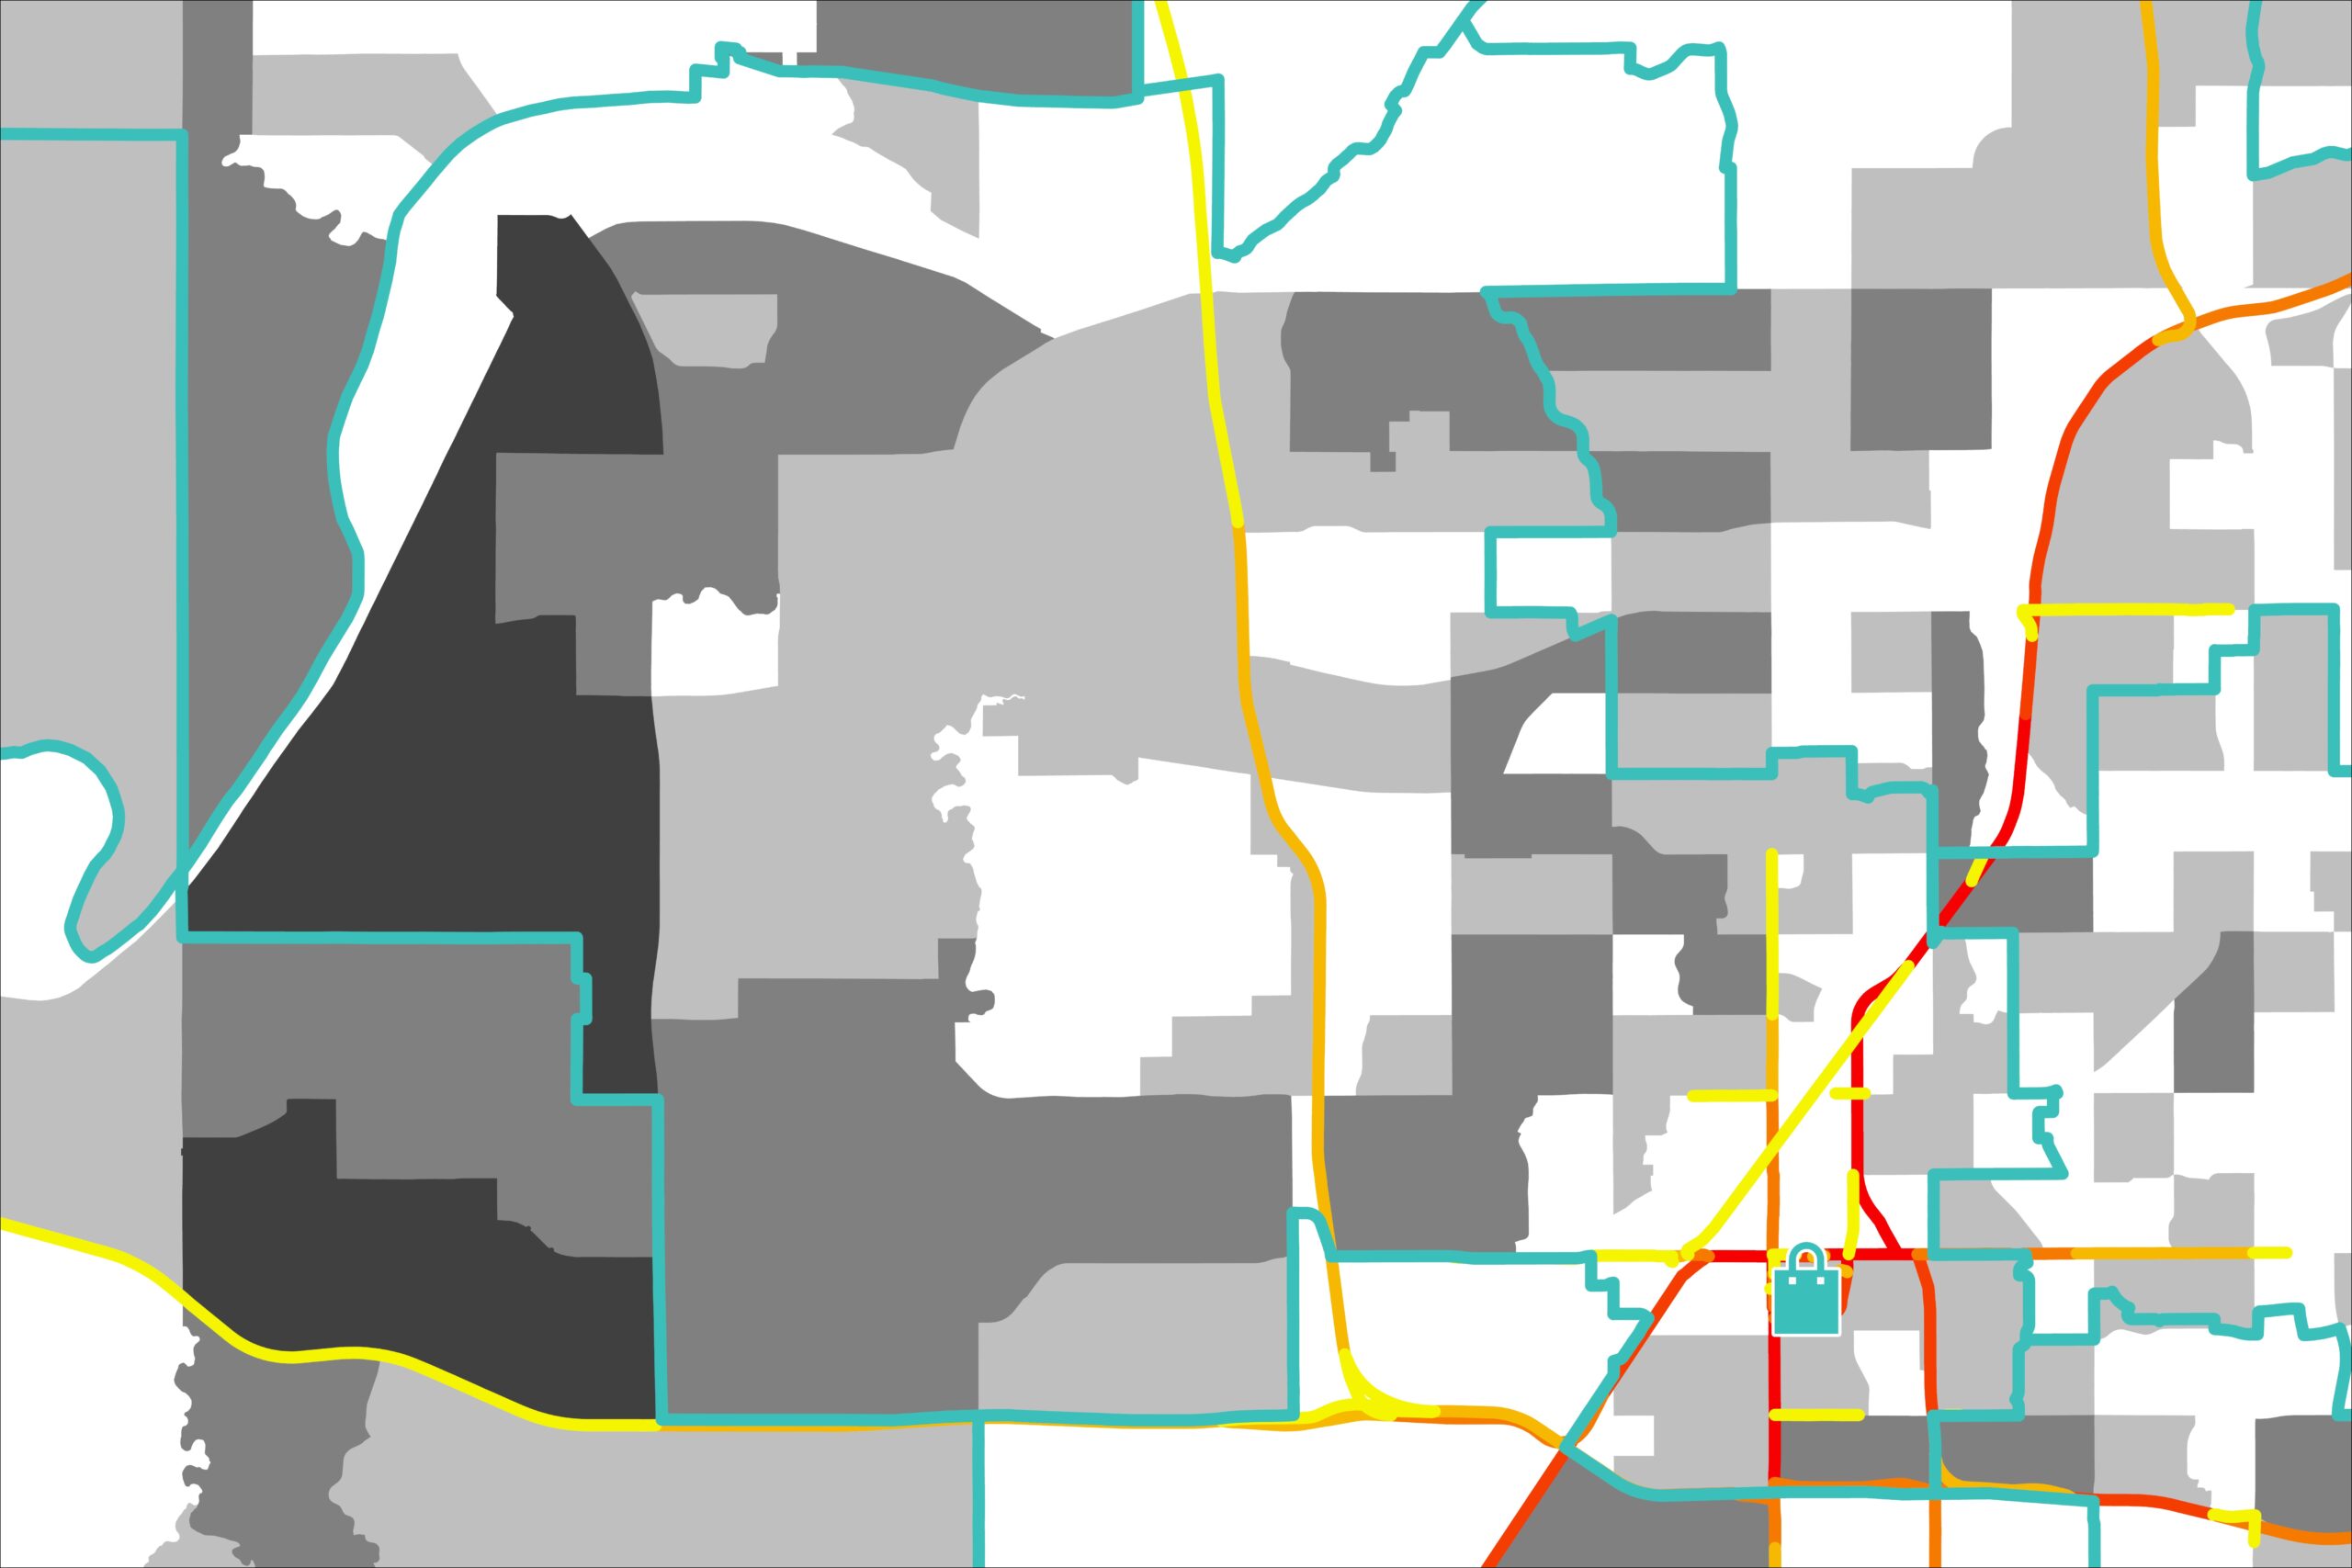
Trade areas modeled from the retail network - not rings or ZIPs.
TSCG Markets define shopper-served markets by analyzing retail. Use them to pick sites, plan portfolios, and, when combined with mobile location data, quantify reach and performance.
TSCG Retail Markets remove these pain points by providing consistent, retail-centric boundaries with clean demographic integrity, so teams can make decisions with confidence instead of compromise.
Why it’s different
Evidence over heuristics: Boundaries follow real retail corridors, anchors, and competition – never arbitrary radius or ZIP lines.
Granular & consistent: 4,400+ markets across the US, with stable IDs for tracking and trend analysis. No space left behind!
Decision-ready: Easily pinpoint white space, co-tenancy targets, and cannibalization footprints to guide site selection and leasing.
Proven scale: 2M+ retail locations modeled and reviewed regularly for coverage you can trust.
What you can do
Turn complex market data into actionable insights that drive smarter retail real estate decisions. TSCG’s Insight Marketplace delivers the clarity to plan with precision and move with confidence.

Pick Sites with Confidence
Use market reality, not rings or random drive-times, to gauge potential and reduce surprises.

Plan Store Locations
See market coverage and prevent overlap to guide infill and sequencing.

Shape Merchandising
Match tenant mixes to corridors that actually support them.

Analyze Faster
Feed natural trade areas into your models and see capture and reach at a glance.
Ready to See Your Market Differently?
Your next opportunity starts with better intelligence. Purchase your Market Reports today.
Other Intelligence Services
FAQ
No. TSCG Markets are built from retail footprints- no device data and no personal data.
Boundaries emerge where retail clusters cohere anchored by major tenants, reinforced by traffic corridors and access, and limited by competitive spacing and demand.
We refresh inputs and market definitions every 3 years.
Yes, we offer both finished reporting and raw data (e.g., GeoJSON/ArcGIS FGB) that can easily be added to your GIS analytics stack.
No—it’s complementary. Mobile location data is powerful, but it reflects marketing bursts, brand pull, novelty, and seasonality. It doesn’t by itself define the structural limit of a location’s natural market or show how completely you’re capturing it. TSCG Markets provides that market “canvas.” When you overlay MLD, you can measure performance against it—reach, penetration, leakage, and lift—without guessing.
Use TSCG Markets to: set true market boundaries, find white space and overlap/cannibalization, size potential, and guide network strategy.Use MLD to: quantify capture vs. potential, diagnose leakage, assess campaign lift, and understand cross-shopping and dayparts.
No. If you don’t have the bandwidth, our TSCG Intelligence Team can deliver turnkey analyses and recommendations using TSCG Markets.